
Polls are an integral part of elections and their impact on election results is worth exploring. My survey research seeks to answer two related questions: “Do tight races result in high voter turnout?” and, more generally, “Does the presences of polling data of any kind affect voter turnout?” After presenting respondents with a local election vignette, this survey exposed respondents to one of three polling scenarios, depicting a lopsided race, a tight race, and one with no polling data at all. The experiment found that the tightness of the race had little effect on respondents’ propensity to vote, as measured by asking if they wished to receive additional information about the election at hand. Conversely, it found that control group respondents who were presented with no polling data were more likely to request additional information. These findings suggest that ambiguity regarding the tightness of a race encourages voting while the existence of polling data, regardless of race tightness, discourages voting. These results can guide further research on the potential effect of polling data on voter turnout, indicating that over reporting polls, regardless of what they suggest, may negatively impact turnout.
Below, I have attached some of the visual aids used to present my experiment and findings, due to upload quality, they have been attached both as in-text images and links to view the figures more clearly.
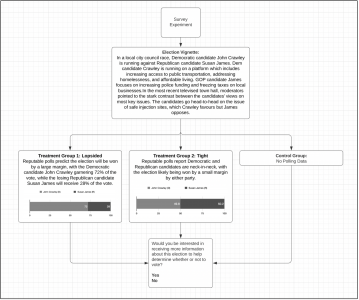
The experimental design for my project presented respondents with an election vignette, which illustrated a local election result, and then split participants into three experimental groups. These groups are as follows, Treatment Group 1: Lopsided, which presented respondents with a poll demonstrating a race that is not close and in which one candidate will win by a significant margin; Treatment Group 2: Tight, which presented respondents with a poll demonstrating a tight election in which any candidate could win; and a Control Group in which respondents were not presented with any polling data, only the election vignette. Developing my election vignette was a challenge, as I balanced providing respondents with enough information that the race felt real and authentic, while also understanding the attention span of most respondents who likely would not read more than a a few sentences. Similarly, deciding what kind of election the vignette would depict was challenging. Ultimately, I decided to create a hypothetical local, city council election. This way, respondents would believe this election was actually occurring, flying under the radar in a way that presenting a hypothetical congress or presidential election would not, hopefully eliciting respondents' true voter behaviour.
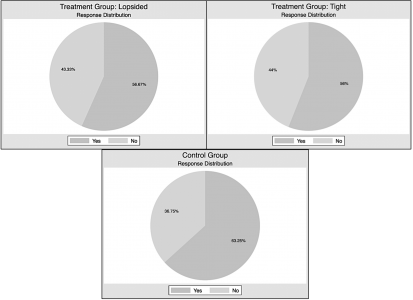
Ultimately, as these graphs show, the magnitude of my results was small, with almost no difference between treatment groups but a measurable difference between both treatment groups and the control group. This was not the result I was expecting, but presented a learning opportunity for myself as a researcher: That even if the result differs from what is predicted, that does not mean the experiment failed. The results I got were still very interesting to me, offering a new finding, that ambiguity with regard to polling and race tightness leads to greater voter turnout.
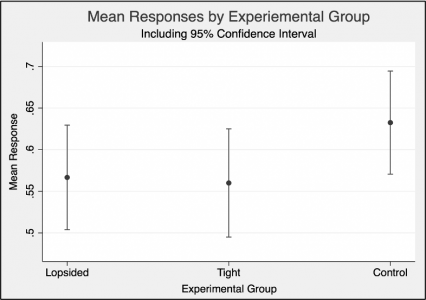
Difference of Means and Statistical Significance:
Learning how to create, interpret, and explain this error bar graph was an integral learning outcome of my research, increasing my proficiency with Stata coding and statistical analysis. This graph shows the mean response for each treatment group as well as the 95% confidence interval for these means. This graph shows that not only is there little between treatment group means, but overlapping error bars indicate any difference is likely not statistically significant. While the error bar for the control group also overlaps slightly with the treatment groups, it does not overlap to the same extent, demonstrating more statistically significance in the differences of treatment and control means.
Poll results are often reported as certainties, presenting voters with information that includes no ambiguity regarding who will win and who will lose. Moreover, the current social, technological, and social climate, including the dominance of cable news, especially in the United States, influence of social media platforms, and political polarization contributes to a situation in which polls are widely reported and discussed across media platforms, and may become a focal point of election discourse. Yet no poll can definitively tell the public what the results of the election will be, as this is something only the certified results can do. The survey results from this experiment help illuminate the potential negative effect of the overreporting of polls on voter turnout: If citizens internalize a false sense of security from polls presented as certainties, there exists the potential for them not to cast a ballot.
This research began with a desire to measure whether the presence of polling data affected one’s propensity to vote, yet throughout its development, it evolved into a study of the effects of race tightness. Interestingly, the results lead us back to this initial discussion of the impact of polling data, as the difference observed is not between tight and lopsided elections, but between the inclusion and exclusion of polling data. While these findings may be only marginally significant, they indicate avenues for further research regarding the effects of polls on voter turnout and contribute to the ongoing discussion of how polls are best and most responsibly reported, especially if this experiment’s finding, that ambiguity regarding race tightness leads to increased voter turnout, holds true.
This project helped me gain new skills, including how to create and run a survey using Qualtrics, and practice preexisting skills, such as statistical analysis. This research was challenging, at times pushing me outside my comfort zone which, in turn, presented me with many opportunities for growth and learning, and better preparing me for my future studies and career.